Notice that TR and TE are numbers *you* choose on the console, but T1 and T2 are not — they are baked into the tissue (and into the field strength). So where do a tissue’s T1 and T2 actually come from?
The one-sentence version: **relaxation is most efficient when molecules tumble at roughly the same frequency the protons are precessing at (the Larmor frequency).
Molecules that tumble near that frequency can trade energy with their neighbors efficiently, giving a **short T1**.
– Fat — medium-sized lipid molecules tumble slowly, close to the Larmor frequency, so energy exchange is efficient → **short T1** (bright on T1).
– Free water / CSF — small, fast-tumbling molecules are “off resonance” for this exchange, so recovery is inefficient → long T1. Being liquid, they also dephase slowly → long T2 (bright on T2).
– Large, immobile molecules and solids — proton neighbors sit in fixed
relationships and dephase almost instantly → very short T2 (dark everywhere).
Rough teaching numbers at 1.5 T (they shift with field — T1 lengthens at 3 T):
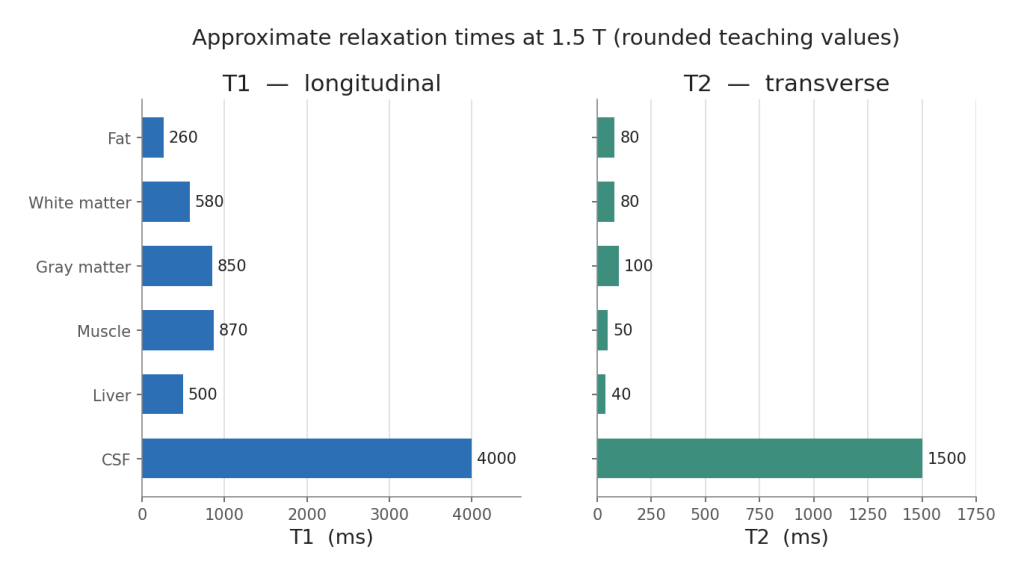
Two things to carry to the PACS station. First, T2 is always shorter than or equal to T1 for a given tissue — a tissue can’t lose its transverse signal more slowly than it recovers longitudinally. Second, these are the intrinsic numbers our knobs are playing against; TR and TE only decide which of these differences you convert into contrast.
We have quietly assumed the signal simply “decays by T2” over TE. In a real scan, getting that measurement takes a small piece of machinery: the echo.

