We keep saying “long TR” and “short TR,” but what is TR physically doing? To answer that, we have to look at what the magnetization does *between* pulses. Right after an RF pulse tips the magnetization, the longitudinal component `Mz` (the part lined up with the main magnet) has been knocked down. It then climbs back toward its full value `M0`, and it does so exponentially, with a time constant we call T1:
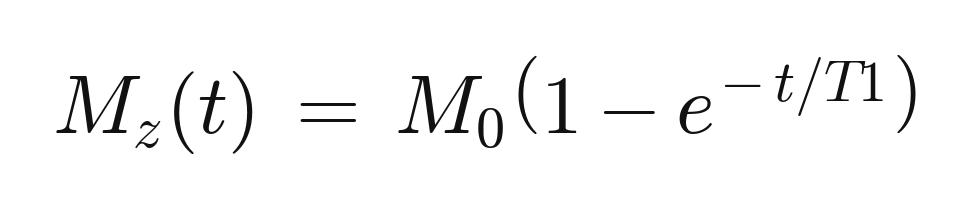
That is the same `(1 − e^(−…))` shape from our signal equation — now you can see where it comes from. TR is simply how long we wait before the next pulse, i.e. how far along this recovery curve we let each tissue climb before we sample it.
Here is the payoff. Draw the recovery curve for a short-T1 tissue like fat and a long-T1 tissue like CSF, then drop a vertical line at a short TR:
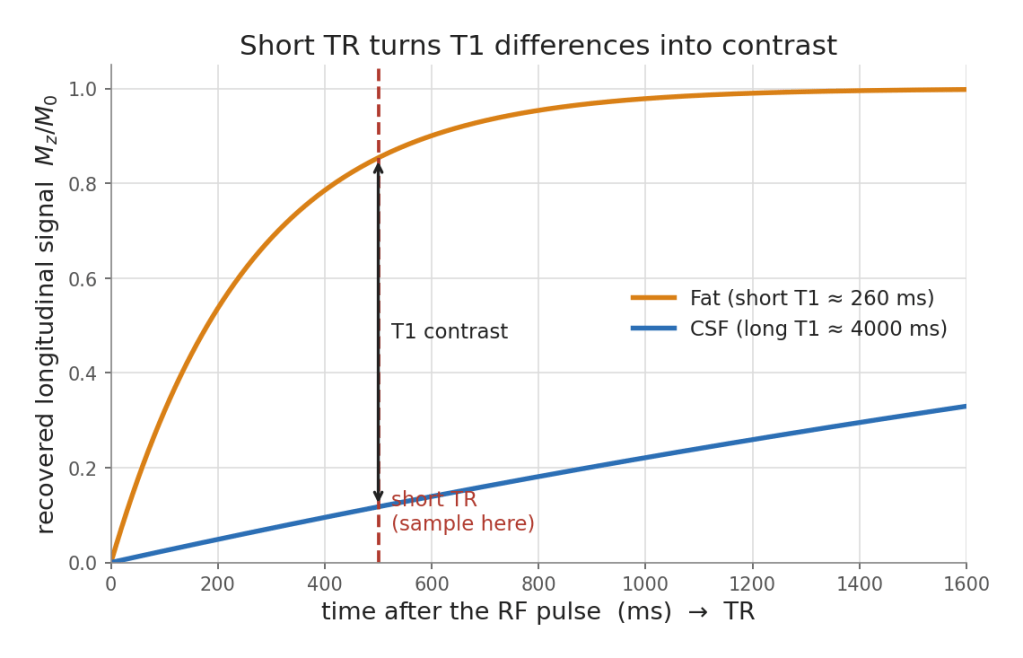
At a short TR, fat has already recovered most of its signal (bright) while CSF has barely started (dark). The vertical gap between the curves creates your T1 contrast.
Wait too long (very long TR) and both tissues finish recovering, the curves meet, and the T1 contrast disappears — which is exactly why the T2 and PD images used a long TR to erase T1 differences.
Next, the other knob: what TE is doing while the signal decays.

